
Learn
Learning Center
These pages explain laboratory documents and analytical terms used when reading a research peptide certificate of analysis. They are written for lab work. They are not product pages, and they give no instructions for use in people or animals.
For research use only. Not for human or animal consumption.
17 articles

Certificates
What is a certificate of analysis?
A certificate of analysis is a lab's report on one batch of material. What it contains, who issues it, and how it differs from a spec sheet.
COABasics
Read article
Certificates
How to read a peptide certificate of analysis
A walk through a peptide certificate of analysis from header to signature: sample block, test table, chromatogram and mass spectrum.
COAReading a report
Read article
Certificates
How to spot an altered or reused certificate of analysis
The patterns that show up when a certificate of analysis has been edited, recycled across lots or cropped.
COADocument checks
Read article
Endotoxin
What are endotoxins, and why do they show up on a COA?
Endotoxins are fragments of bacterial cell walls that survive purification. What they are and how labs measure them.
EndotoxinCOA
Read article
Chromatography
What is a chromatogram?
A chromatogram is the chart a separation produces: signal against time, one peak per component.
HPLCChromatogram
Read article
Chromatography
What an HPLC purity figure means
HPLC purity is an area percent under one method. The formula, a worked example, and what a single figure does and does not say.
HPLCPurity
Read article
Chromatography
Purity vs assay on a lab report
Purity is a relative share of peak area. Assay is a measured amount against a reference standard.
PurityAssay
Read article
Chromatography
What is retention time?
Retention time is when a compound comes off the column. What sets it, why it shifts, and why it can only be compared within one method.
HPLCRetention time
Read article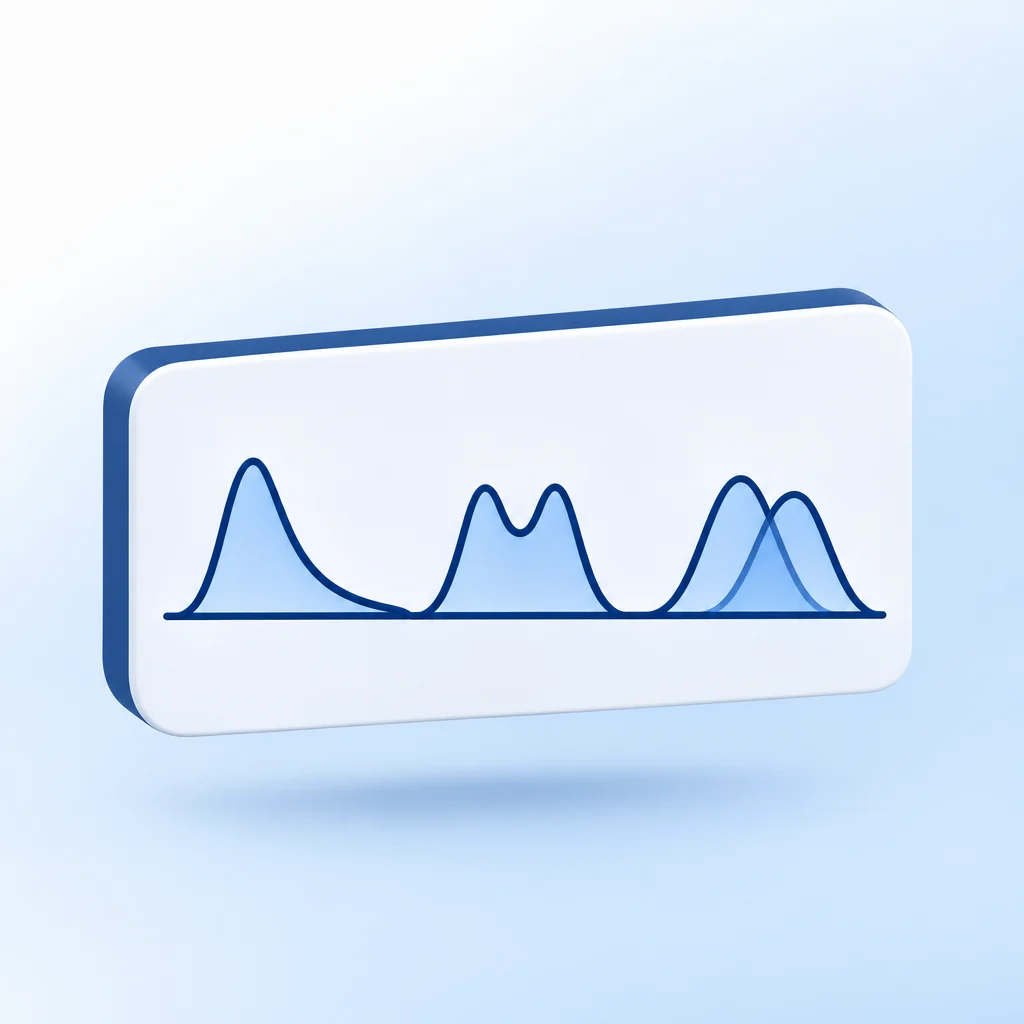
Chromatography
Split, tailing and overlapping peaks: reading odd peak shapes
What tailing, fronting, split and overlapping peaks look like on an HPLC chromatogram, and what usually causes them.
HPLCPeak shape
Read article
Chromatography
Degradation, oxidation and aggregation: how they show up in the data
How oxidation, deamidation, hydrolysis and aggregation change a peptide, and where each one tends to show up in the data.
StabilityHPLCMass spec
Read article
Mass spec
HPLC vs mass spectrometry: two questions, two tests
HPLC says how much of a sample is one component. Mass spec says what that component is.
HPLCMass spec
Read article
Mass spec
HPLC vs LC-MS: same separation, different detector
LC-MS is HPLC with a mass spectrometer as the detector. What that adds, and why purity usually still comes from the UV trace.
HPLCLC-MS
Read article
Mass spec
How mass spectrometry confirms a peptide's identity
How a mass spectrometer turns a peptide into ions, why one peptide shows several peaks, and how a lab matches mass to sequence.
Mass specIdentity
Read article
Mass spec
Peptide molecular weight and the mass spectrum
What a peptide's molecular weight is, monoisotopic versus average mass, and how the mass spectrum on a COA checks it.
Mass specMolecular weight
Read article
Lyophilization
What is lyophilization?
Lyophilization removes water from frozen material by sublimation under vacuum. The three stages and what the cake looks like.
LyophilizationBasics
Read article
Related analysis
Heavy metals testing and ICP-MS on a certificate of analysis
How ICP-MS measures trace metals such as lead, arsenic, cadmium and mercury, and how to read an elemental impurities line.
ICP-MSMetalsCOA
Read article
Comparing reports
Why lab tests disagree: method, sample and timing
Two honest labs can test one lot and print different numbers. How method, sample and timing each move a figure.
MethodSampleTiming
Read articleResearch use only
Peptira supplies materials for laboratory research. For research use only. Not for human or animal consumption. Not for diagnostic or therapeutic use. These pages explain lab documents and analytical terms. They are not medical advice.